Data Insights
Course analytics for lab instructors, from first research to shipped feature.
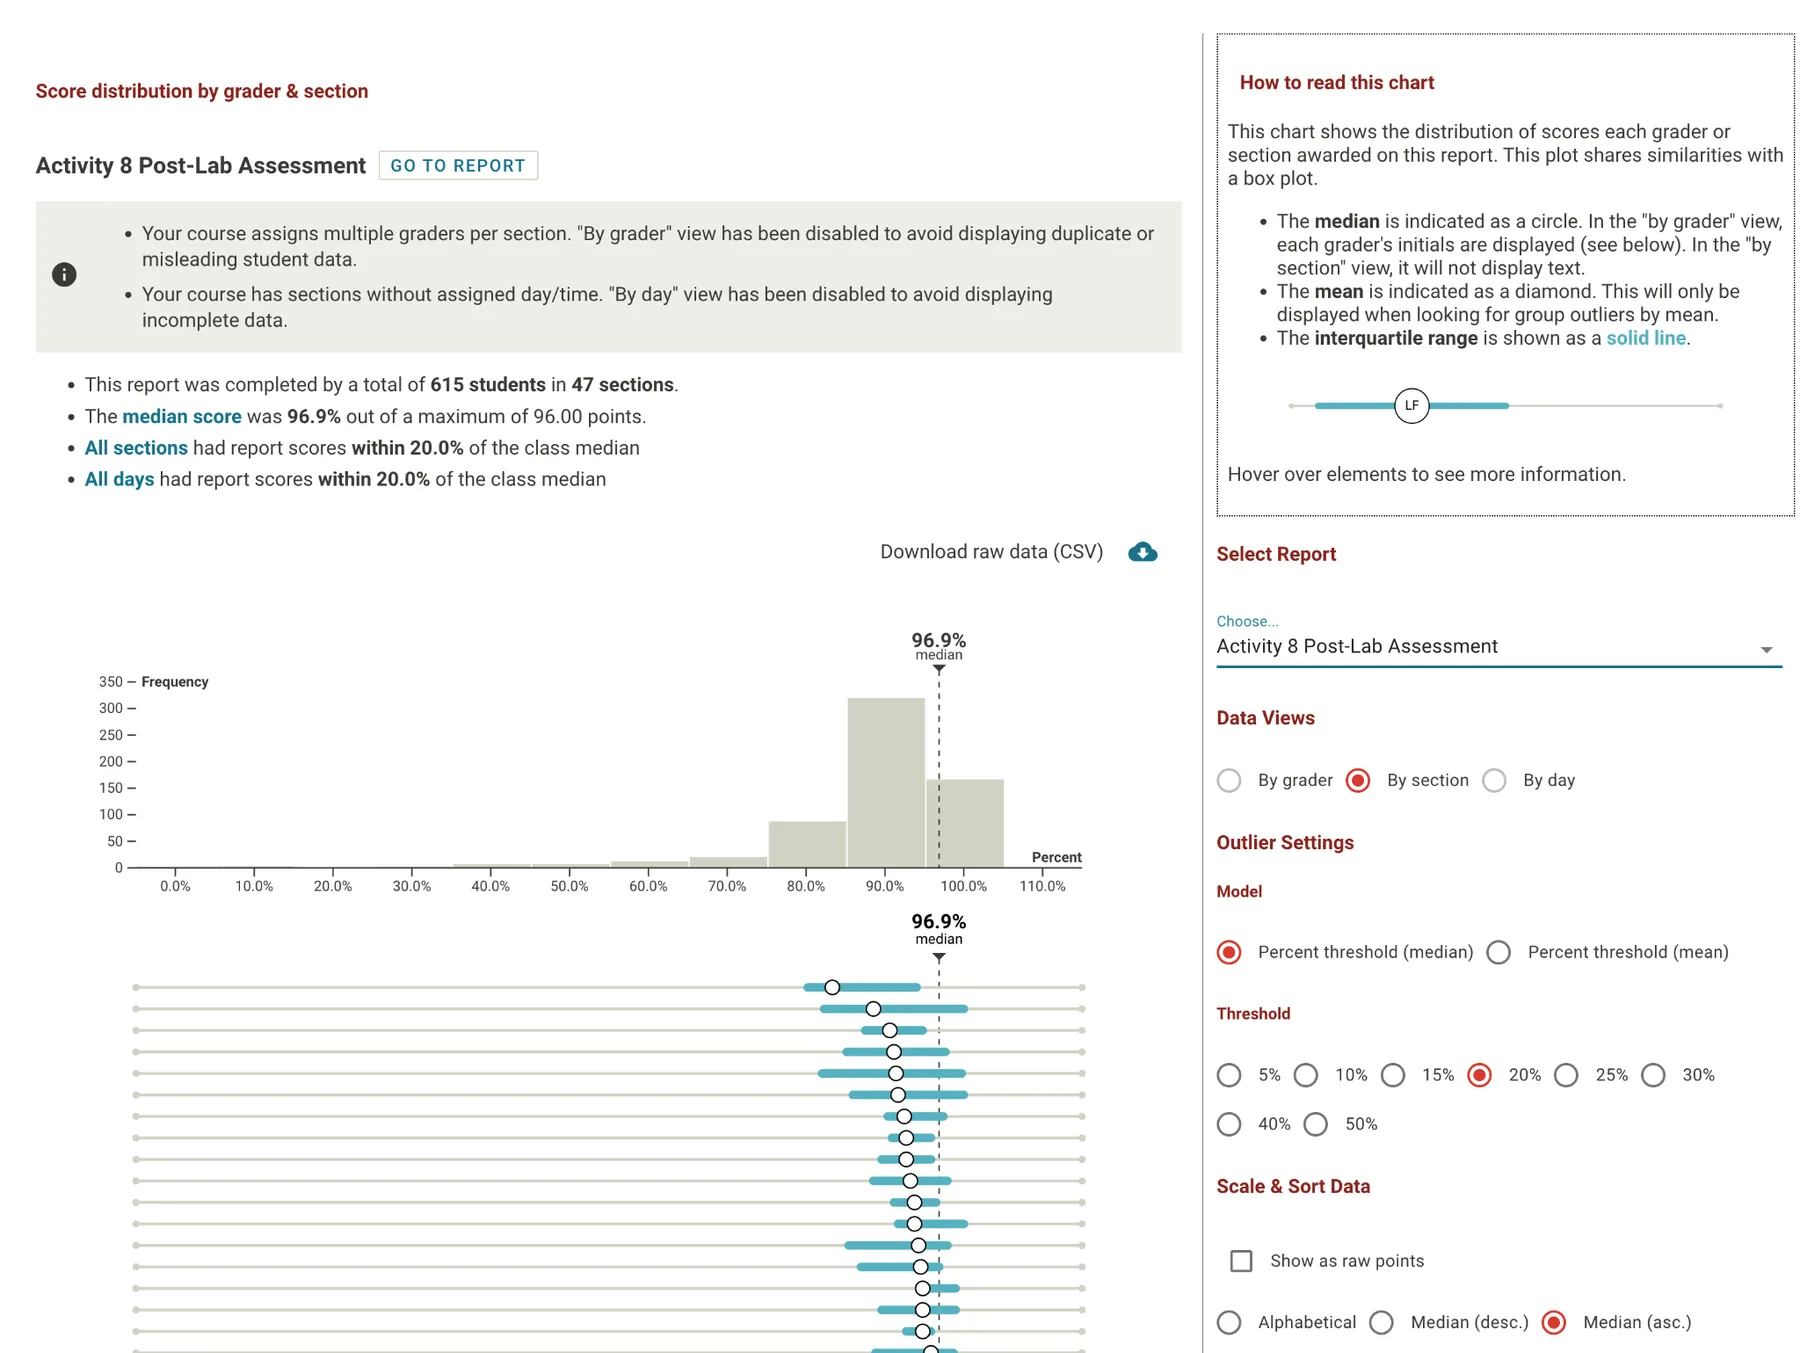
Data Insights is a set of on-demand data visualizations that show university lab instructors how their course is going: how far along grading is, how scores are spread across graders and sections, and how scores change over a semester. I was responsible for the research, design, and evaluation work from start to finish.
The problem
Lab instructors have a hard time keeping tabs on how well their courses are running, and COVID-19 made it worse, because lab courses were especially hard to run remotely. Labflow was already collecting data that could help, and the analytics in off-the-shelf course software are rudimentary. I started by working out what “course health” means in practice, and what data would make it visible.
What I did
I ran a task analysis of how lab courses are administered, and colleagues who had run labs checked my work. It showed three things a healthy course needs: effective course administration, good student engagement, and a quality instructional experience that doesn’t vary much by grader or section. I turned those into design concepts and prototypes, and iterated on them with instructors at medium and large universities. One principle held up throughout: roll data up as little as possible, and let people drill down for more detail. Working with the engineering team, I helped shape the data model around those designs and tune it for performant queries.
What came of it
We released a beta to early adopters in spring 2021, and the first Data Insights dashboard debuted at the American Chemical Society meeting that spring. Instructors responded warmly. Data Insights became a market differentiator for Labflow and a cornerstone of sales pitches and demos, and it was an adoption factor in more than $1M of new sales in 2023–24.